Star Wars Survey
Project: Star Wars Survey
Allen Jackson
Objectives:
- Clean and analyze dataset using pandas
- Visualize data with matplotlib
The data explored in this project came from a survey that asked respondents questions related to the original Star Wars sage. The survey included demographic questions such as age and gender as well as opinions of various topics related to the Star Wars franchise. I’m going to clean some of the data so it can be used for analysis and then see what inferences I can make from the data.
import pandas as pd
import numpy as np
star_wars = pd.read_csv("star_wars.csv", encoding="ISO-8859-1")
star_wars.head(10)
star_wars = star_wars[star_wars['RespondentID'].notnull()]
The first two columns are yes or no questions. By mapping the Yes or No responses to True and False I can change these columns into a Boolean.
yes_no = {'Yes': True, 'No': False}
question1 = 'Have you seen any of the 6 films in the Star Wars franchise?'
question2 = 'Do you consider yourself to be a fan of the Star Wars film franchise?'
star_wars[question1] = star_wars[question1].map(yes_no)
star_wars[question2] = star_wars[question2].map(yes_no)
The next six columns are related to whether or not the respondent had seen each of the six movies. The column names were listed as unnamed. I extracted the column names and reassigned them as ‘seen’ followed by a number indicating the movie. The response to these columns were listed as the movie’s title or as a null value. I reassign these values as Booleans using a dictionary for each column.
star_wars.columns = ['RespondentID',
'Have you seen any of the 6 films in the Star Wars franchise?',
'Do you consider yourself to be a fan of the Star Wars film franchise?',
'seen_1',
'seen_2', 'seen_3', 'seen_4', 'seen_5', 'seen_6',
'ranking_1',
'ranking_2', 'ranking 3', 'ranking_4', 'ranking_5',
'ranking_6',
'Please state whether you view the following characters favorably, unfavorably, or are unfamiliar with him/her.',
'Unnamed: 16', 'Unnamed: 17', 'Unnamed: 18', 'Unnamed: 19',
'Unnamed: 20', 'Unnamed: 21', 'Unnamed: 22', 'Unnamed: 23',
'Unnamed: 24', 'Unnamed: 25', 'Unnamed: 26', 'Unnamed: 27',
'Unnamed: 28', 'Which character shot first?',
'Are you familiar with the Expanded Universe?',
'Do you consider yourself to be a fan of the Expanded Universe?Âæ',
'Do you consider yourself to be a fan of the Star Trek franchise?',
'Gender', 'Age', 'Household Income', 'Education',
'Location (Census Region)']
episode1_check = {np.NaN: False, 'Star Wars: Episode I  The Phantom Menace': True}
episode2_check = {np.NaN: False, 'Star Wars: Episode II  Attack of the Clones': True}
episode3_check = {np.NaN: False, 'Star Wars: Episode III  Revenge of the Sith': True}
episode4_check = {np.NaN: False, 'Star Wars: Episode IV  A New Hope': True}
episode5_check = {np.NaN: False, 'Star Wars: Episode V The Empire Strikes Back': True}
episode6_check = {np.NaN: False, 'Star Wars: Episode VI Return of the Jedi': True}
The following 6 columns (Columns 10 to 16) consist of a total ranking number by film. I convert these values to numeric so they can be aggregated into visualizations:
star_wars['seen_1'] = star_wars['seen_1'].map(episode1_check)
star_wars['seen_2'] = star_wars['seen_2'].map(episode2_check)
star_wars['seen_3'] = star_wars['seen_3'].map(episode3_check)
star_wars['seen_4'] = star_wars['seen_4'].map(episode4_check)
star_wars['seen_5'] = star_wars['seen_5'].map(episode5_check)
star_wars['seen_6'] = star_wars['seen_6'].map(episode6_check)
star_wars[star_wars.columns[9:15]] = star_wars[star_wars.columns[9:15]].astype(float)
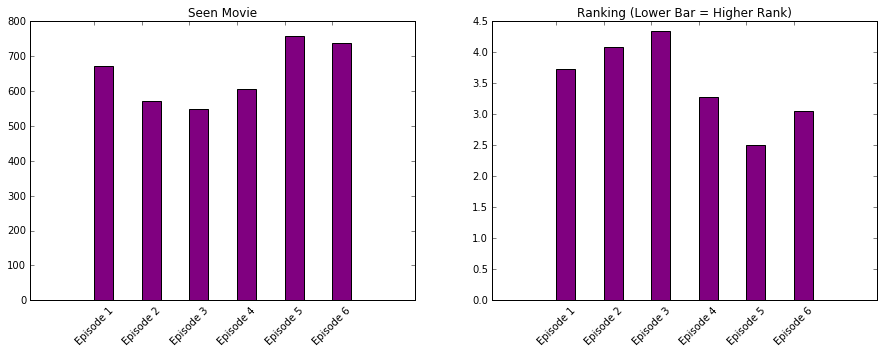
%matplotlib inline
Episodes = ['Episode 1', 'Episode 2','Episode 3', 'Episode 4','Episode 5', 'Episode 6']
import matplotlib.pyplot as plt
fig = plt.figure(figsize = (40,5))
sub1 = fig.add_subplot(1,5,1)
sub1.bar([2,4,6,8,10,12],star_wars.sum()[3:9], color = 'purple', tick_label = Episodes )
sub1.margins(x = .25)
sub1.title.set_text('Seen Movie')
tick = plt.setp(sub1.xaxis.get_majorticklabels(), rotation=45)


sub2 = fig.add_subplot(1,5,2)
sub2.bar([2,4,6,8,10,12],star_wars.mean()[9:15], color = 'purple', tick_label = Episodes )
sub2.margins(x = .25)
sub2.title.set_text('Ranking (Lower Bar = Higher Rank)')
tick0 = plt.setp(sub2.xaxis.get_majorticklabels(), rotation=45)
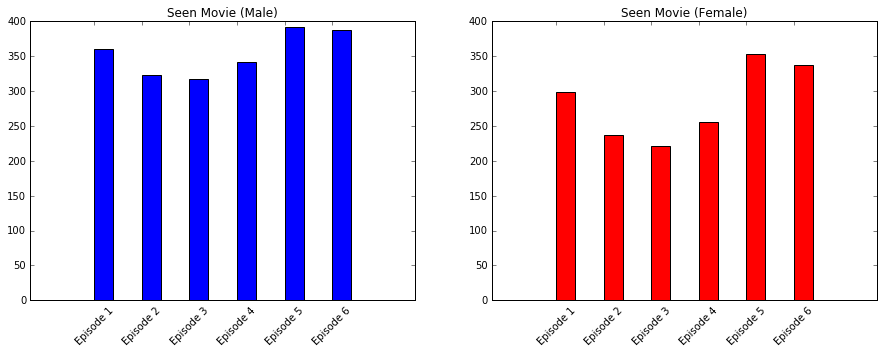
%matplotlib inline

males = star_wars[star_wars['Gender'] == 'Male']
females = star_wars[star_wars['Gender'] == 'Female']
sfig = plt.figure(figsize = (40,5))
ssub1 = sfig.add_subplot(1,5,1)
ssub1.bar([2,4,6,8,10,12],males.sum()[3:9], color = 'blue', tick_label = Episodes )
ssub1.margins(x = .25)
ssub1.title.set_text('Seen Movie (Male)')
tick1 = plt.setp(ssub1.xaxis.get_majorticklabels(), rotation=45)

ssub2 = sfig.add_subplot(1,5,2)
ssub2.bar([2,4,6,8,10,12],females.sum()[3:9], color = 'red', tick_label = Episodes )
ssub2.margins(x = .25)
ssub2.title.set_text('Seen Movie (Female)')
tick2 = plt.setp(ssub2.xaxis.get_majorticklabels(), rotation=45)
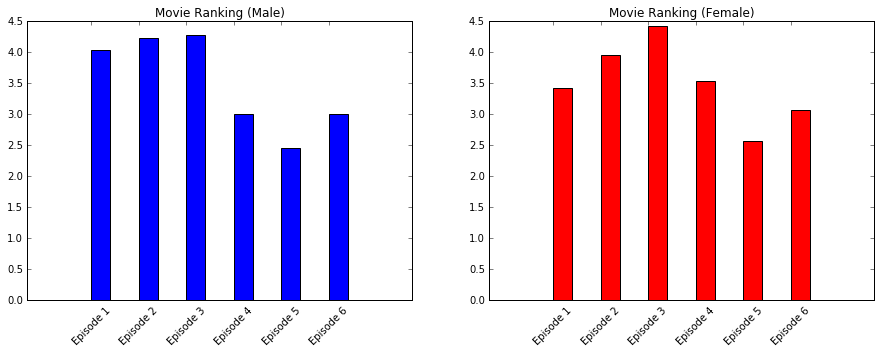
%matplotlib inline

sfig = plt.figure(figsize = (40,5))
ssub1 = sfig.add_subplot(1,5,1)
ssub1.bar([2,4,6,8,10,12],males.mean()[9:15], color = 'blue', tick_label = Episodes )
ssub1.margins(x = .25)
ssub1.title.set_text('Movie Ranking (Male)')
tick3 = plt.setp(ssub1.xaxis.get_majorticklabels(), rotation=45)

ssub2 = sfig.add_subplot(1,5,2)
ssub2.bar([2,4,6,8,10,12],females.mean()[9:15], color = 'red', tick_label = Episodes )
ssub2.margins(x = .25)
ssub2.title.set_text('Movie Ranking (Female)')
tick4 = plt.setp(ssub2.xaxis.get_majorticklabels(), rotation=45)